本部分說明
以下為專案管理員主題:設定、成員、表單類型、儀表板與整合。此處變更會影響整個專案。
儀表板和分析
使用儀表板深入了解專案的授權活動。追蹤表單計數、批准率和團隊生產力。
儀表板概述
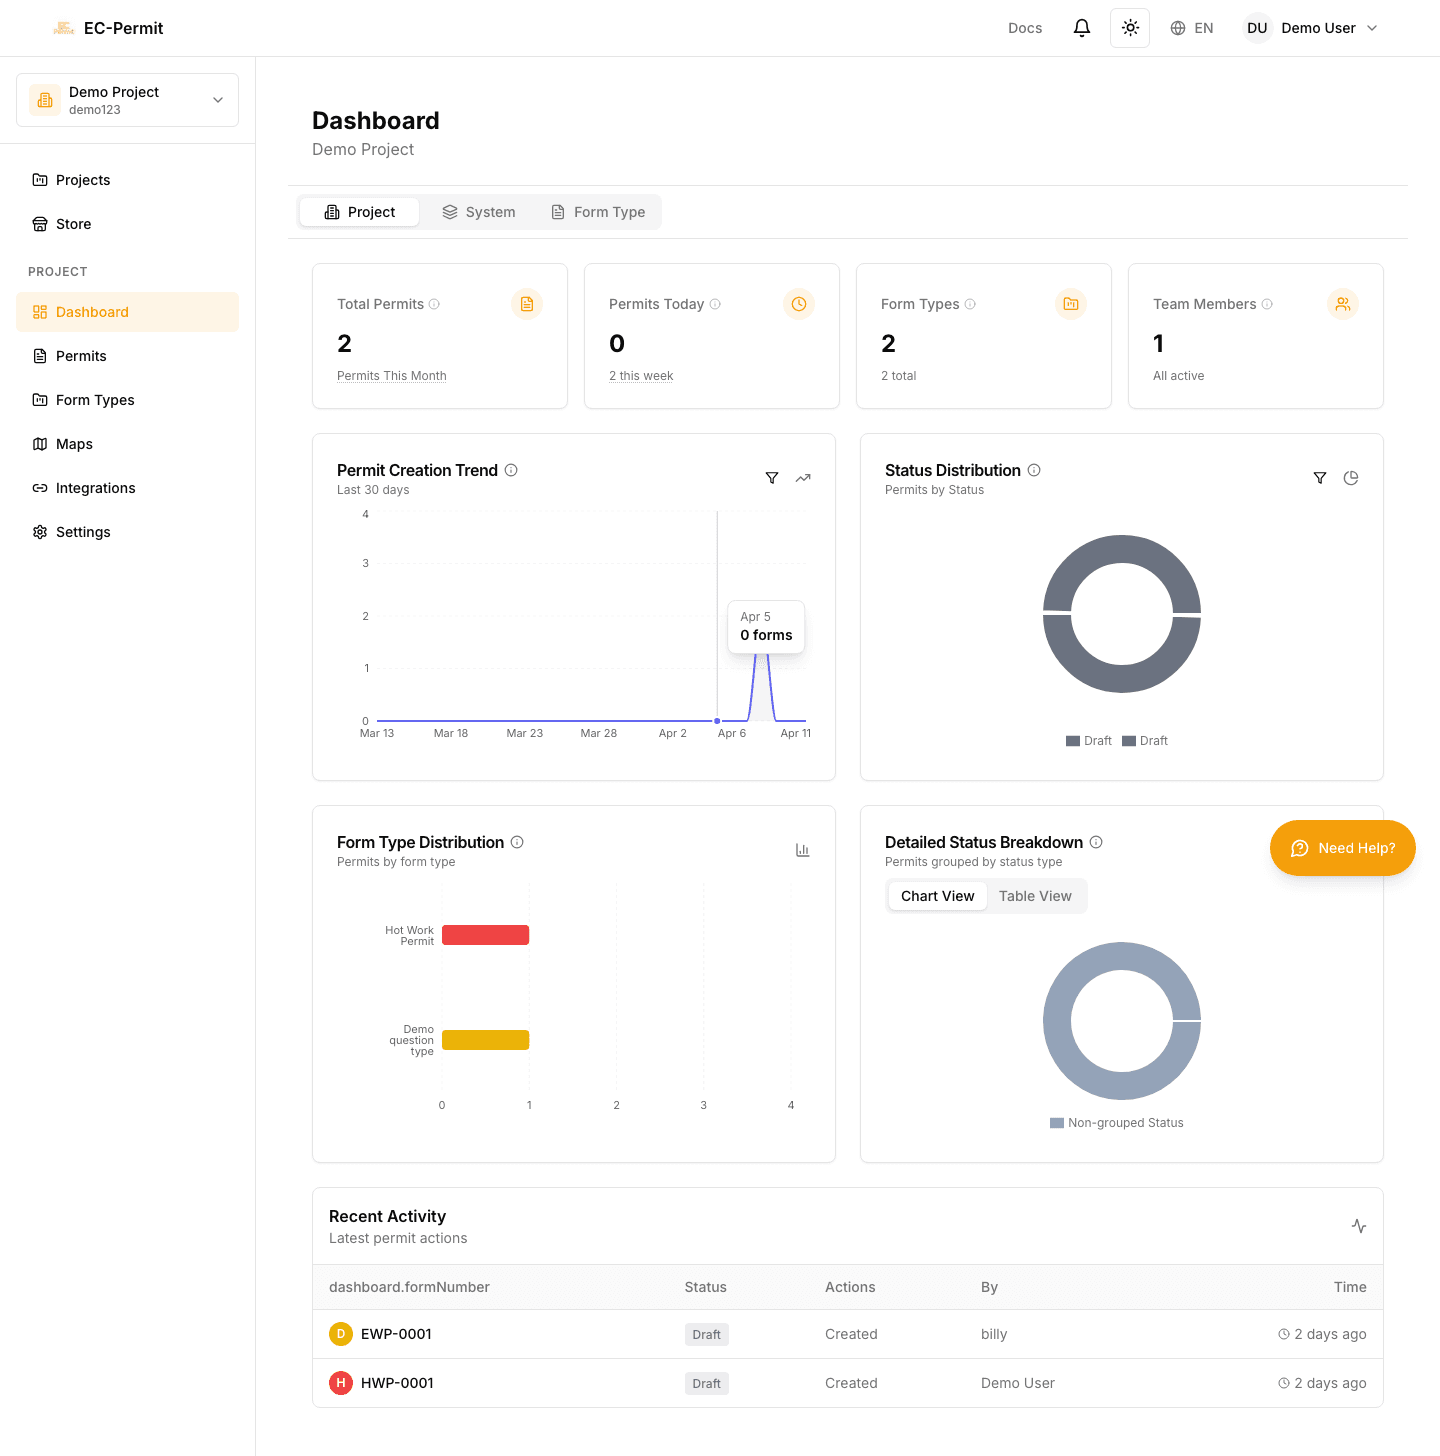
專案儀表板是開啟專案時看到的第一個頁面。它提供:
主要統計數據
表格總數
該項目中建立的所有表單的計數
按狀態劃分的表格
明細顯示有多少是草案、待決、批准等。
按類型劃分的表格
最常用的是哪些表單類型
通過率
提交的表格獲得批准的百分比
平均批准時間
表格通常等待批准多長時間
過濾數據

使用日期過濾器來分析特定時期:
過去 7 天
過去 30 天
本月/上個月
自訂日期範圍
圖表和可視化

儀表板包括互動式圖表:
- 長條圖
- 每天/每週/每月建立的表格
- 圓餅圖
- 狀態分佈
- 折線圖
- 隨時間變化的趨勢
點擊圖表部分可深入查看特定數據。您也可以將儀表板資料匯出為 CSV 以供進一步分析。
最近的活動來源

活動來源顯示整個專案的最新操作:
表單建立、提交、批准、拒絕
誰採取了每個行動以及何時採取的
點擊任何項目即可查看表格
PDF模板編輯器
地圖和地點
後續步驟
建議繼續閱讀: